

Power BI Dashboard Demo
Automotive Sample Data Demo
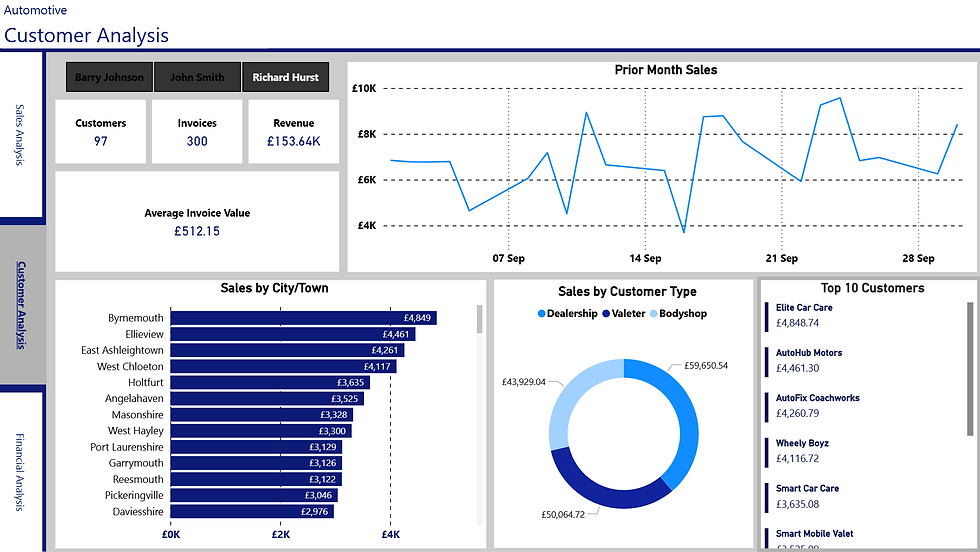
The below screenshots are of on of our latest PowerBI Dashboards published.
This proof of concept was approved by one of our clients who sells Car Cleaning products to the Automotive Industry.
The client required a solution which provides three simple views: Sales, Customer and Financials. The primary goal of this report was to provide a clear picture of Sales Performance, Customer behaviours and a Financial Snapshot in one single report.
A collection of sample tables was provided by the client in order to build out the reporting views. Once the structure was approved by the client, a final solution was built.
Please scroll through the images below to see further details of the dashboard. Visit our desktop website via tablet or computer to access the interactive dashboard solution.
Automotive Sample Data Demo
The below dashboard is an interactive demo that will allow you to click through various filters and elements of the dashboard.
This proof of concept was approved by one of our clients who sells Car Cleaning products to the Automotive Industry.
The client required a solution which provides three simple views: Sales, Customer and Financials. The primary goal of this report was to provide a clear picture of Sales Performance, Customer behaviours and a Financial Snapshot in one single report.
A collection of sample tables was provided by the client in order to build out the reporting views. Once the structure was approved by the client, a final solution was built.
Please click through the dashboard to apply various filters of the data.


Our Approach
The TTS Way
We have a 4 Stage process approach to providing your business with a PowerBI Solution.
At first, we will be working closely with you document the current situation in your business. It is important to undertand the "as-is" prior to getting to the "to-be" where your business is today and what you want to achieve. Together, we shape a clear brief that defines your key metrics, challenges, and goals.
From there, we take a closer look at your data — reviewing its quality, structure, and how it’s currently used — to make sure the foundations are solid.
Once that groundwork is complete, we create an initial dashboard that brings your data to life. You’ll see how everything connects, with the opportunity to refine and adjust along the way.
The final stage focuses on delivery and adoption — providing the finished solution, full training, and a smooth handover so your team can start using it confidently from day one.
The TTS Way
The final stage is all about confidence and handover. In Implement, we deliver the completed dashboard, provide user training, and ensure your team is comfortable using the solution day to day. We focus on smooth adoption — so that insights aren’t just available, but actually drive better decisions. Once live, you’ll have a self-sufficient, scalable Power BI solution ready to grow with your business.
Implement
4
Once we understand the landscape, we move into Build. Here, we bring your data to life through a sample dashboard — an early working version that shows structure, design, and initial insights. This is a hands-on, interactive stage where you can test ideas, give feedback, and refine details. We address any data issues and make sure the visuals align with the way your team thinks and works. The goal is a dashboard that feels intuitive, accurate, and relevant.
Build
3
With the goals agreed, we shift focus to your data. During the Investigate stage, we carry out a full review of your data sources, quality, and structure. We look at how information currently flows through your business and where it could be improved. This stage often surfaces valuable insights on its own — helping you understand not just what data you have, but how it can be used more effectively.
Investigate
2
We work with you to understand how your business operates today and where you want to be tomorrow. This is a collaborative discovery process — identifying pain points, defining key metrics, and uncovering the questions your data should be able to answer. The outcome is a clear scoping document that captures priorities, objectives, and measures of success, giving everyone a shared direction before any technical work begins.