

Power BI & Reporting
What Is a Power BI Dashboard? A Practical Guide for UK SMEs
Discover what a Power BI dashboard is, how it can help your business understand performance, and what UK SMEs should consider before investing in one.
Related Insights

Excel vs Power BI: When Should a Business Make the Move?
"The right tool doesn't just show you data - it helps you make better decisions."
Key Takeaways
Power BI dashboards simplify complex business data.
Dashboards provide a clear view of key business performance.
Good dashboards focus on the KPIs that matter.
Power BI can work alongside existing tools like Excel.
Introduction
If your business relies on spreadsheets, accounting systems or other sources of data, understanding what is really happening can become increasingly difficult as you grow. A Power BI dashboard brings your key business information together into a clear, visual view, helping you monitor performance and identify trends, issues and opportunities.
But what exactly is a Power BI dashboard, what can it show, and is it actually useful for a small or medium-sized business? In this guide, we explain the basics and what UK SMEs should consider before investing in one.
What is a Power BI dashboard?
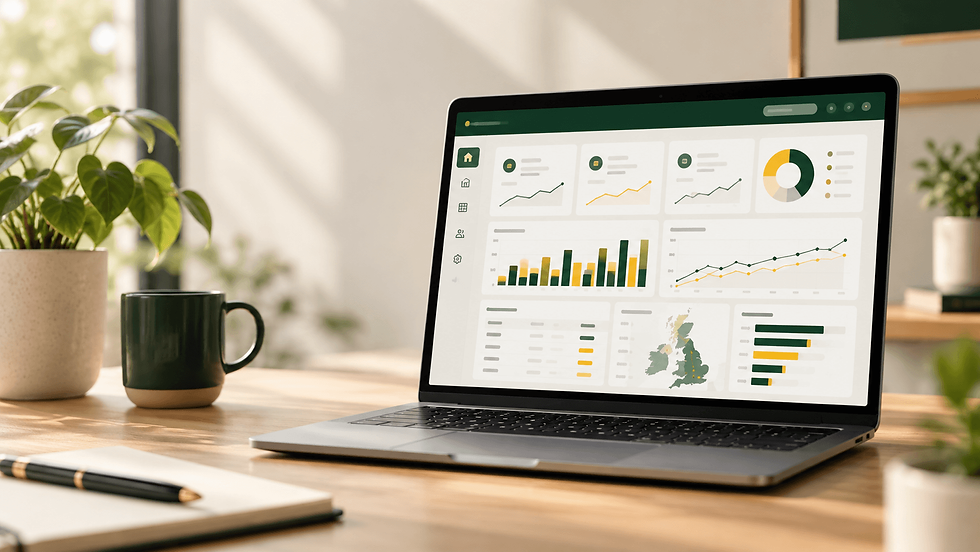
A Power BI dashboard is a visual way of presenting important business information in one place. It can bring together key metrics, charts, graphs and other visualisations to give you a quick view of what is happening across your business.
For example, a sales dashboard might show:
Total sales
Sales against target
Sales by customer
Sales by product or service
Monthly sales trends
Average order value
Gross margin
New customers
Outstanding opportunities
Rather than asking someone to manually pull these figures together from different spreadsheets, a well-designed dashboard can present them in a single, easy-to-understand view.
The aim isn't simply to make your data look more attractive.
The aim is to make your data easier to understand and act upon.
Microsoft defines a Power BI dashboard specifically as a single-page canvas containing visualisations. Dashboards are created in the Power BI Service rather than Power BI Desktop, and the visualisations displayed on a dashboard can come from one or more underlying reports and semantic models.
Power BI dashboard vs Power BI report: what's the difference?
This is one area that often causes confusion.
People frequently use the terms dashboard and report to mean the same thing.
Within Power BI, however, they are different.

A Power BI report can contain multiple pages of interactive visualisations. It is designed to allow users to explore and analyse data in more detail.

A Power BI dashboard, on the other hand, is a single-page overview designed to highlight the most important information at a glance.
Think of it like this:
Power BI Report | Power BI Dashboard |
Can contain multiple pages | One-page overview |
Provides deeper analysis | Focuses on key information |
Designed for exploration and analysis | Designed for monitoring |
Based on a single semantic model | Can bring together visuals from different reports |
Allows users to investigate the detail | Gives decision-makers the bigger picture |
For an SME, the distinction is useful.
Your dashboard might tell you that sales are 12% below target.
Your report can then help you investigate why.
Which customers are affected?
Which products are underperforming?
Which salespeople are behind target?
Has the trend changed recently?
This is where a good Power BI solution becomes more than a collection of charts.
What can a Power BI dashboard show?
A Power BI dashboard can be designed around the information that matters most to your business.
There isn't a universal dashboard that every company should use.
A garage, retailer, professional services company and manufacturer will all have different priorities.
For example, a sales dashboard might include:
Revenue
Sales target
Sales growth
Number of new customers
Average order value
Sales pipeline
Revenue by customer
Revenue by salesperson
An operations dashboard might focus on:
Jobs completed
Outstanding jobs
Average completion time
Productivity
Operational costs
Service levels
Capacity
A finance dashboard could include:
Revenue
Gross profit
Gross margin
Operating costs
Debtor position
Cash flow indicators
Budget vs actual performance
The important point is that the dashboard should be built around business questions, rather than simply around the data you happen to have available.
Why are Power BI dashboards useful for SMEs?
For many small and medium-sized businesses, reporting develops organically. A business starts with one spreadsheet, then another.
Then someone creates a sales tracker. Your Finance team then decide to create their own spreadsheet. Operations use another spreadsheet.
Eventually, management has to bring everything together manually to understand what is happening. This can create several problems.
1. Too much time spent preparing reports
If someone spends several hours every week downloading data, manipulating spreadsheets, checking formulas and creating management reports, that is time that could be spent elsewhere.
Automation can reduce much of this repetitive reporting work.
2. Different versions of the truth
One spreadsheet might show £250,000 in sales while another shows £247,500.
Perhaps one has been updated more recently.
Perhaps someone has excluded cancelled orders.
Perhaps another spreadsheet uses a different date range.
Without a consistent reporting model, disagreements over the numbers can become more important than the decisions those numbers are supposed to support.
3. Important information gets buried
A spreadsheet may contain the answer.
But finding it can take time.
A dashboard brings the most important information forward so that decision-makers can see it quickly.
4. Reporting becomes dependent on individuals
If only one person understands how the monthly management report is produced, that can create a significant business dependency.
A properly designed reporting solution can make the process more consistent and repeatable.
5. Decisions are made too late
Perhaps the biggest issue is timing.
If management only discovers a problem during the monthly reporting process, the business may already have lost several weeks responding to it.
A more accessible reporting environment can help businesses identify changes earlier.
Where does the data come from?
A Power BI dashboard doesn't create information by itself.
It connects to the data your business already generates.
Depending on your systems, that might include:
Excel
CSV files
Microsoft SQL Server
SharePoint
Microsoft Dynamics
Accounting systems
CRM systems
ERP platforms
Cloud applications
Business databases
Other supported data sources
Power BI can then bring that information together, transform it where required and present it through reports and dashboards.
This is particularly useful for SMEs because you don't necessarily need to replace every system you currently use.
The opportunity may simply be to connect the systems you already have and make better use of the information they contain.
Is Power BI suitable for a small business?
Yes, but the important question is whether it is suitable for your particular reporting problem.
A small business with very simple reporting requirements may not need a sophisticated business intelligence solution.
But if your business is growing, your data is spread across multiple systems, reporting takes significant manual effort, or management lacks a clear view of performance, Power BI may be worth considering.
The value comes from solving those problems — not from having Power BI simply because it is available.
Power BI dashboards at TTS
At TTS Ltd, we take a business-first approach to Power BI reporting.
Rather than starting with a blank Power BI canvas and asking which charts to add, we start by understanding how the business operates, what information management needs and which decisions the reporting needs to support.
We can then help identify the relevant data sources, structure the information and develop practical Power BI reporting solutions around your requirements. The result isn't simply another dashboard.
It's a reporting solution designed to help your business turn data into decisions.
If your business is spending too much time preparing reports, working across disconnected spreadsheets or struggling to get a clear view of performance, it may be time to look at what your existing data could do for you.
Explore our Power BI Solutions or get in touch with TTS to discuss your reporting requirements.

Start a Conversation
Have a Business Challenge
You Need to Understand?
Sometimes the first step is simply talking through the challenge.
Whether you're dealing with disconnected data, inefficient processes, outdated technology or a wider transformation challenge. We are happy to listen, understand what's happening and explore where we can help.
No obligation. Just a conversation about your business.